
Elum
Role
Concept/Idea, UX design, UX research, Hardware tech, Software development in Python
Collaborators
Hannah Deering, Dillan Laughlin
Problem
There is currently not an easy way (plug and play) to monitor home energy usage in a visual manner to map usage over time. There are units like the Kill-a-watt, but these metrics only show on the plug themselves (usually shin-level) and shows only instant usage, not logging any data showing patterns of use.
Research question
Can real-time monitoring and visualization of energy usage over time impact household energy conservation through better understanding?
Solution
To create a unified, inexpensive system to visually show a user how they utilize energy usage over time without significant modification to home electrical systems (plug and play units that fit over outlets).
About the elum project
What the eLum product is
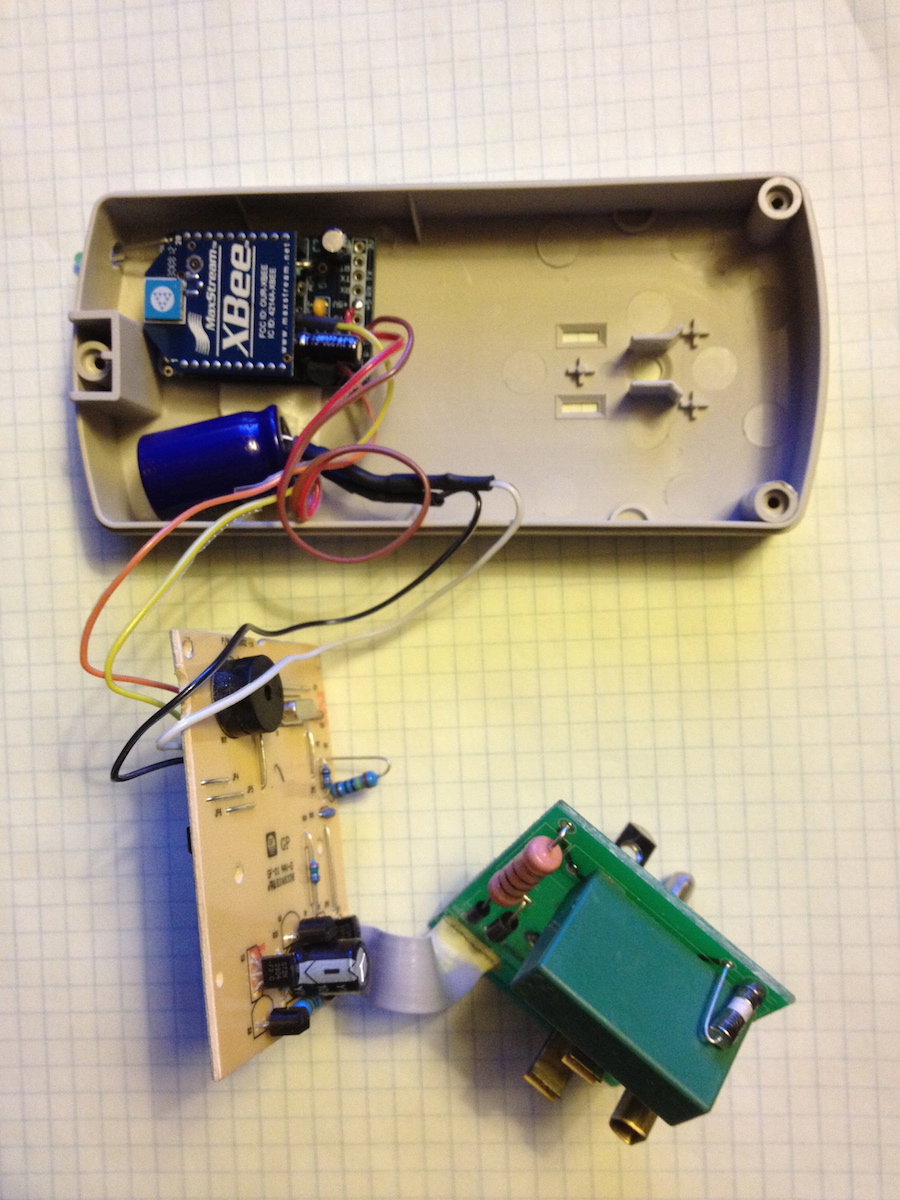
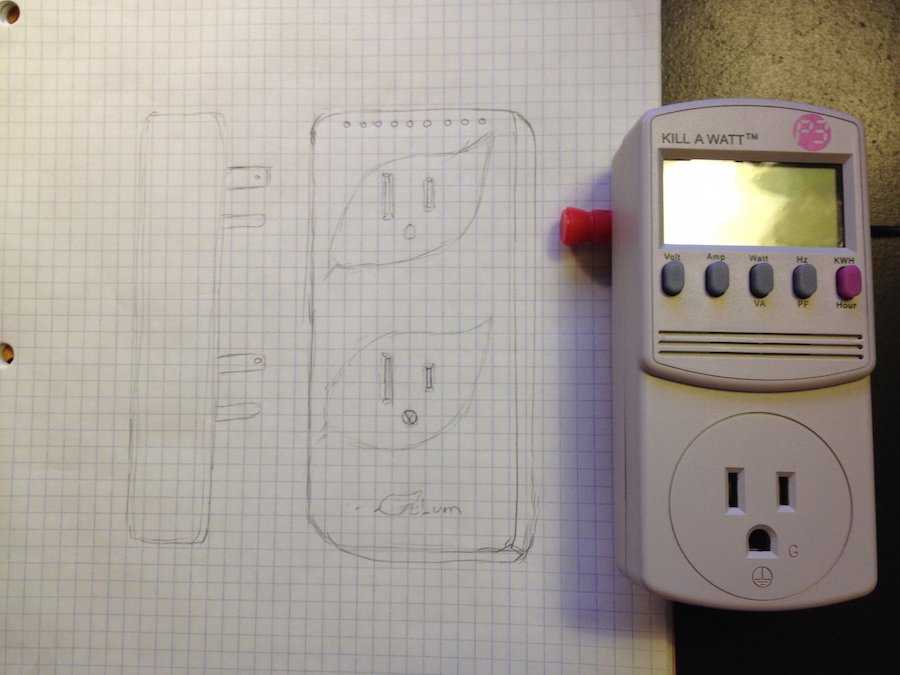
1st. you have the individual plugs that measure wattage/voltage/amps used in real time at the wall plug level. For a prototype, I used an off-the-shelf $19 Kill-a-Watt and soldered in an embedded wireless unit (XBee) that can send that local information to a central location.
2nd.The central server will push all the usage of each defined plug in the house to the cloud where...
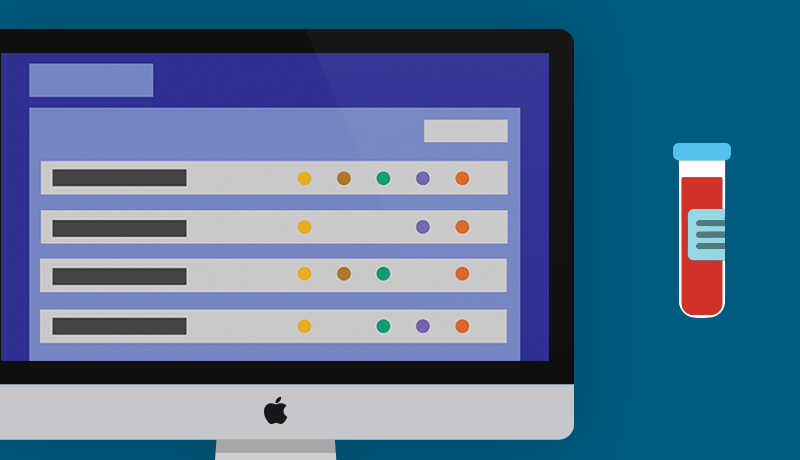
3rd. You can see this usage data in real time on a mobile device like a phone or tablet. The software will have suggestions on how to save power.
This page is documentation of how we came up with the details of the eLum system by using a UX process
elum Impact
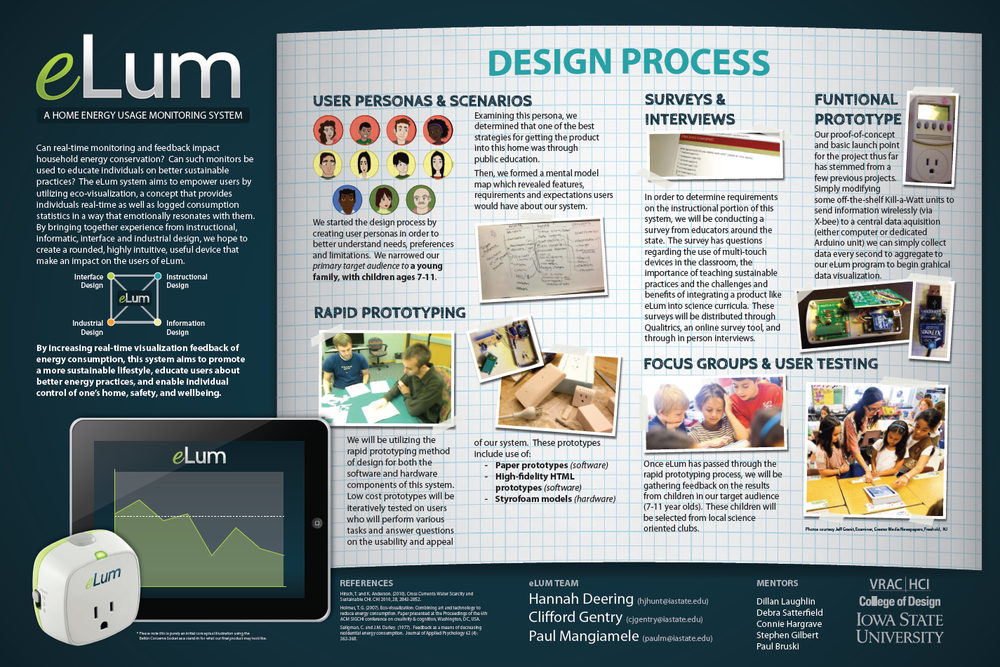
Can real-time monitoring and feedback impact household energy conservation? Can such monitors be used to educate individuals on better sustainable practices? The eLum system aims to empower users by utilizing eco-visualization, a concept that provides individuals real-time as well as logged consumption statistics in a way that emotionally resonates with them. By bringing together experience from instructional, informatic, interface and industrial design, we hope to create a rounded, highly intuitive, useful device that make an impact on the users of eLum.
Process
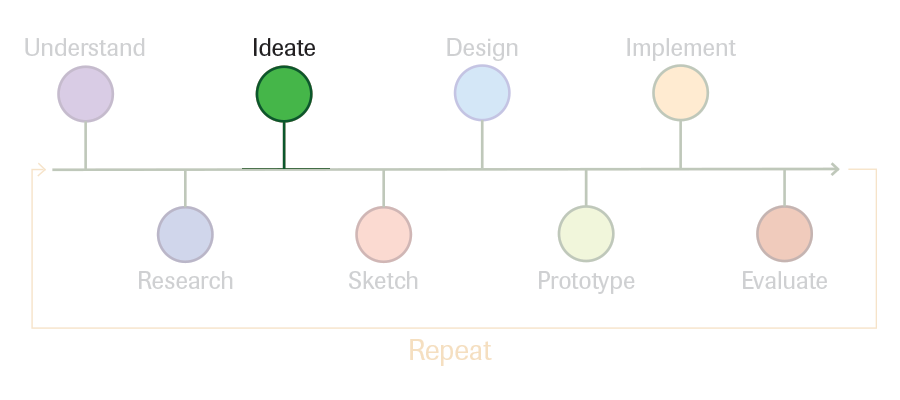
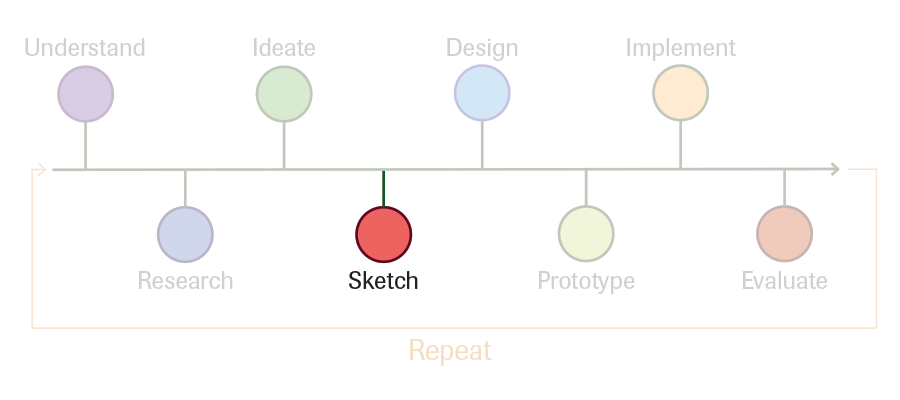
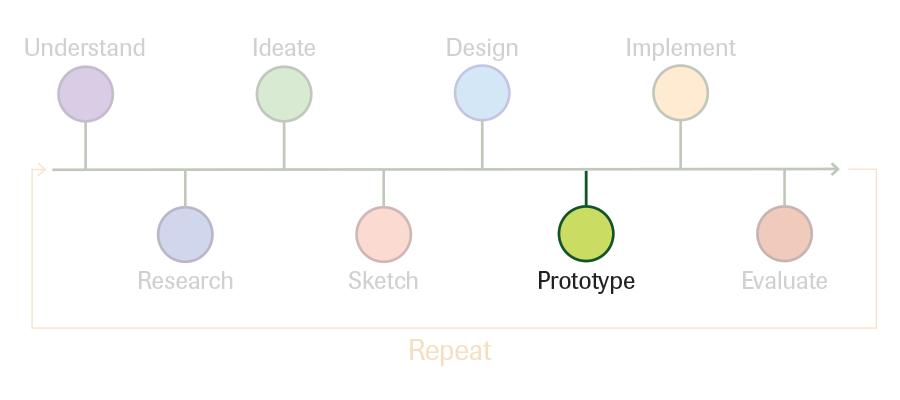
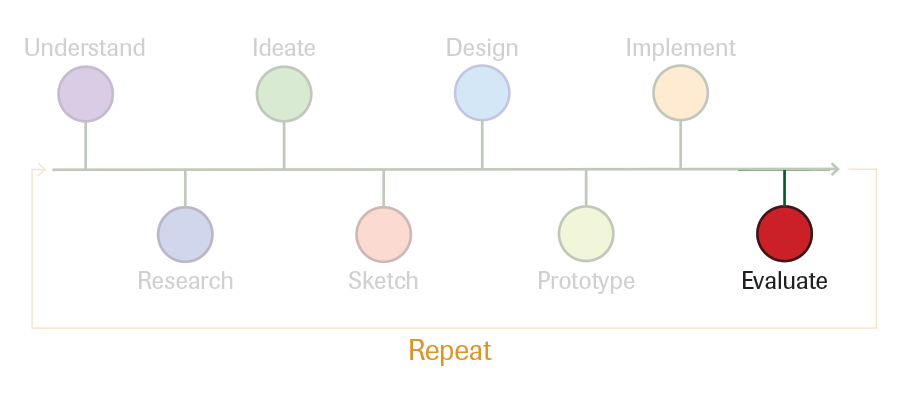
Overview of entire UX process
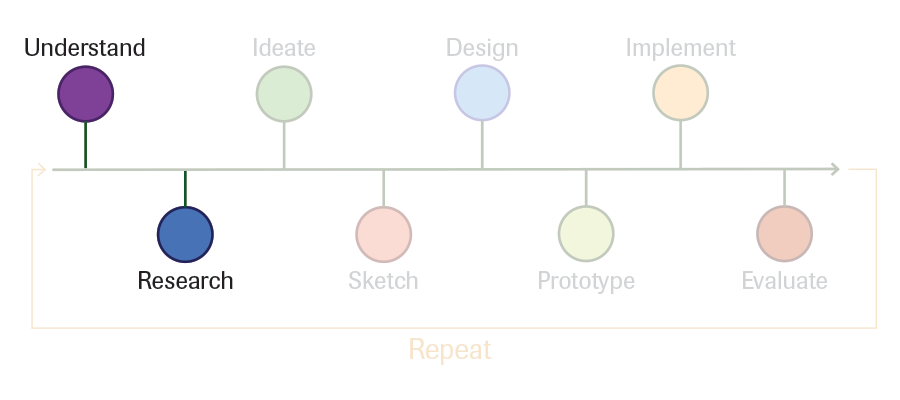
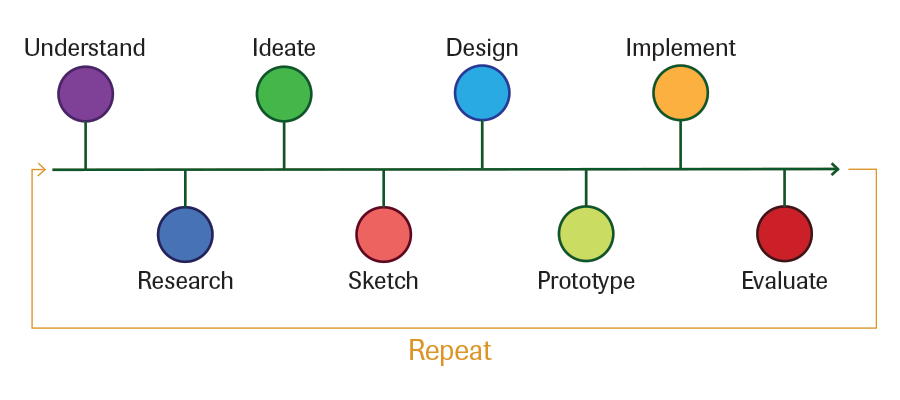
More grainular information on the my general UX process is found here. Every UX process is different for the task at hand, but generally a similar linear path. I'll lead you through this process with visual representation of the steps below.
Initial Idea brainstorm and research
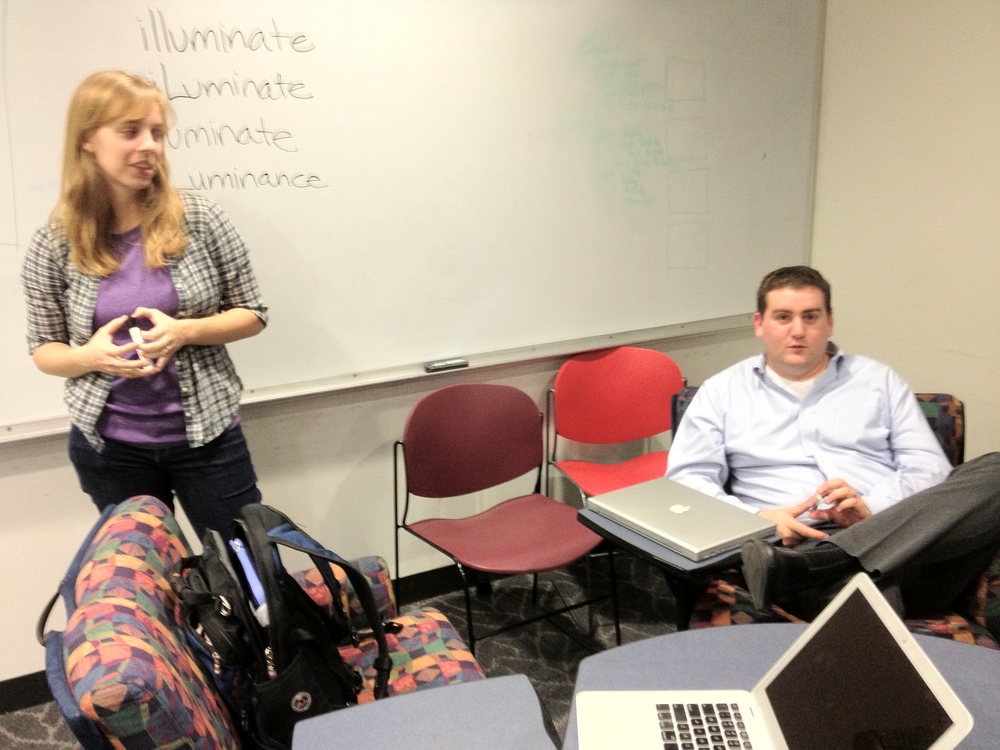
Initial Idea brainstorm
We knew we wanted to monitor electricity usage in a more modern, visual method. But what was the motivation and way we can roll this idea out? Affinity diagramming and lightning brainstorms are a great way to get a group going on the same path:
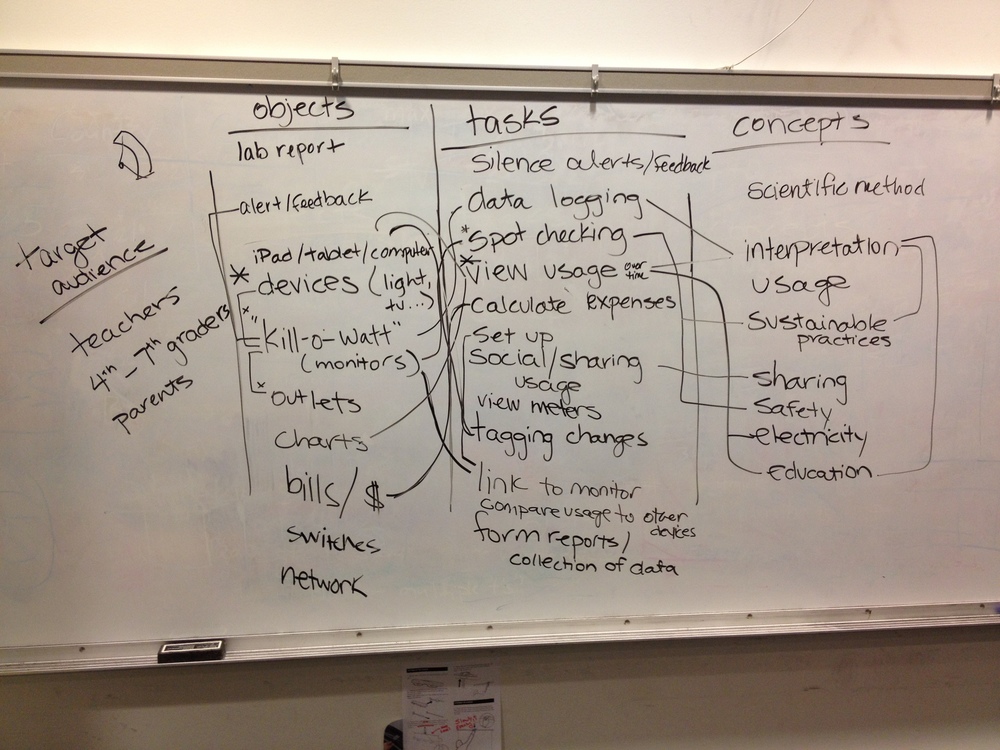
Current task flow for users
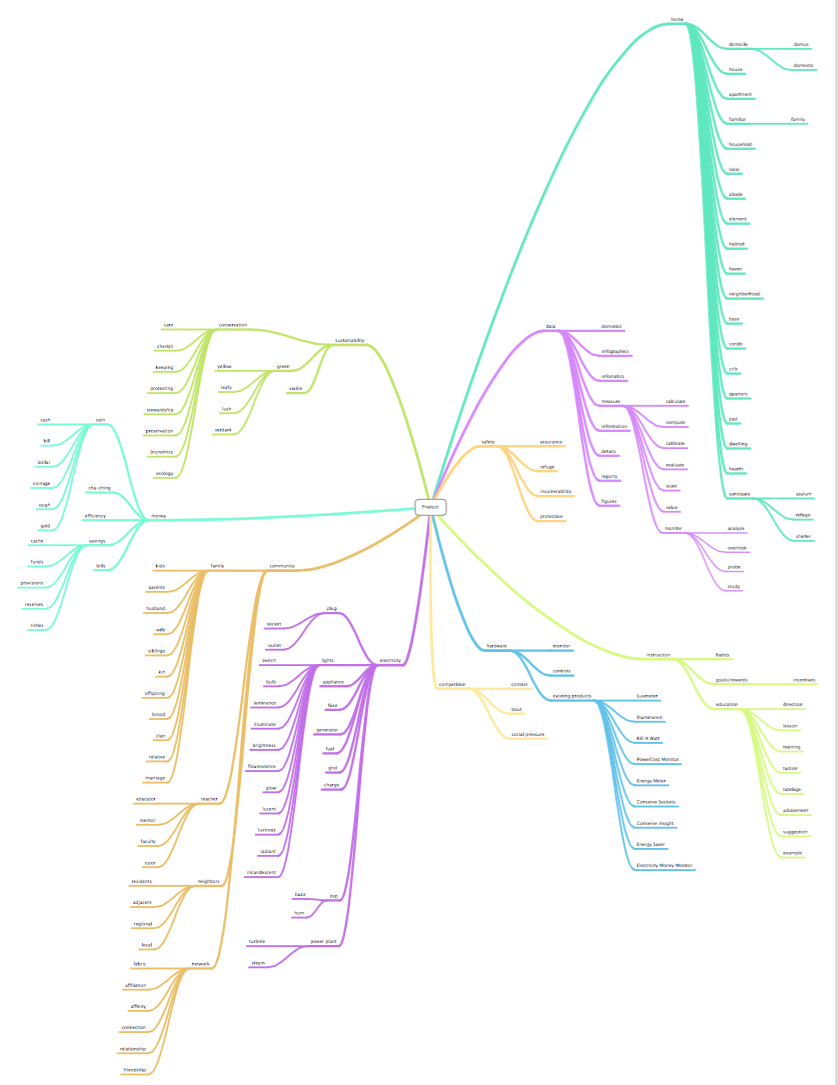
From these discussions, we developed a mind map then into a simple sketch of the proposed idea:
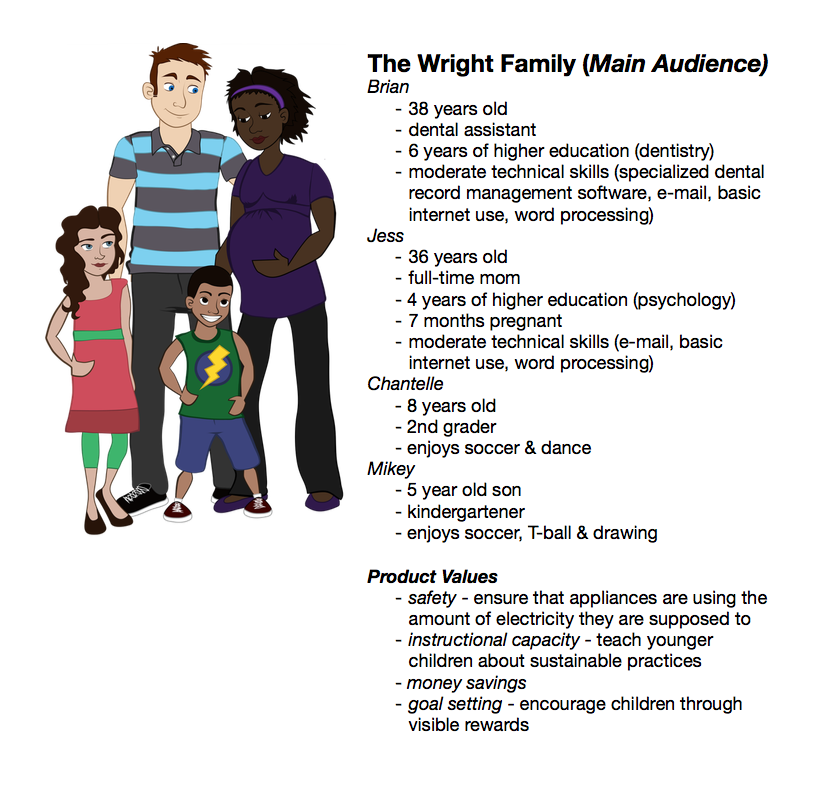
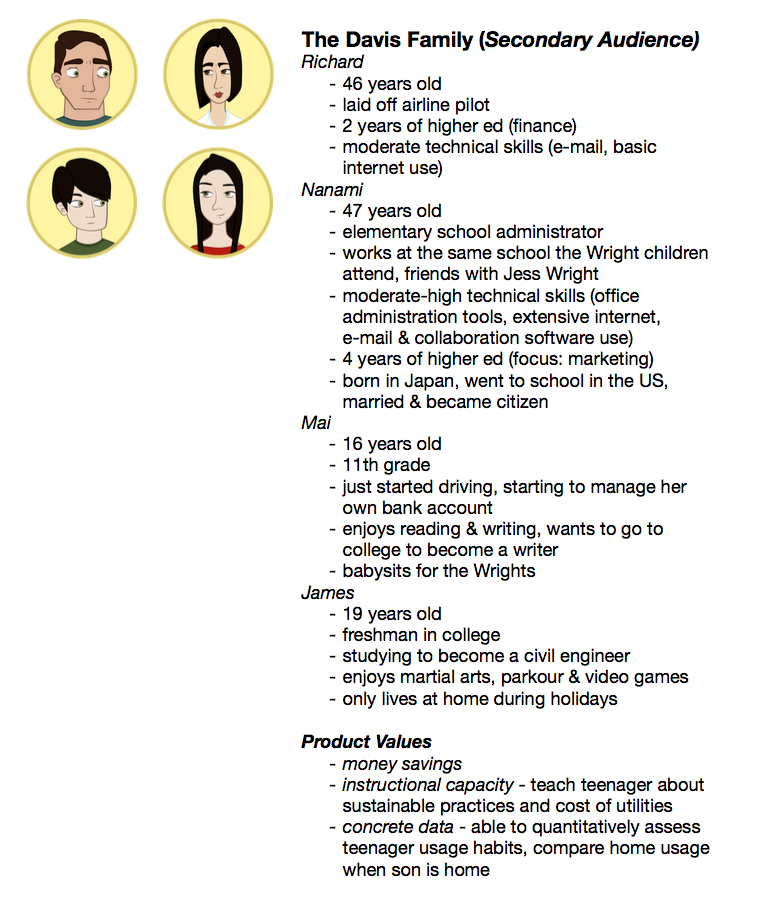
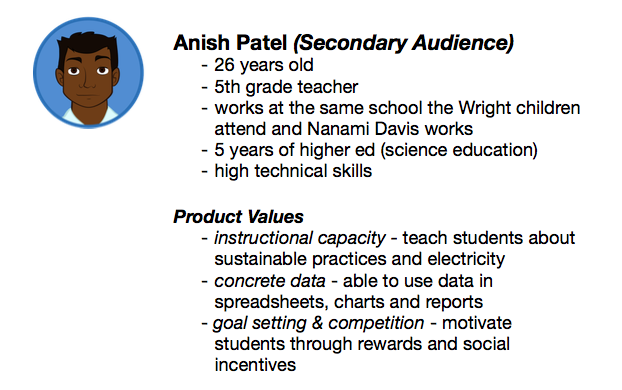
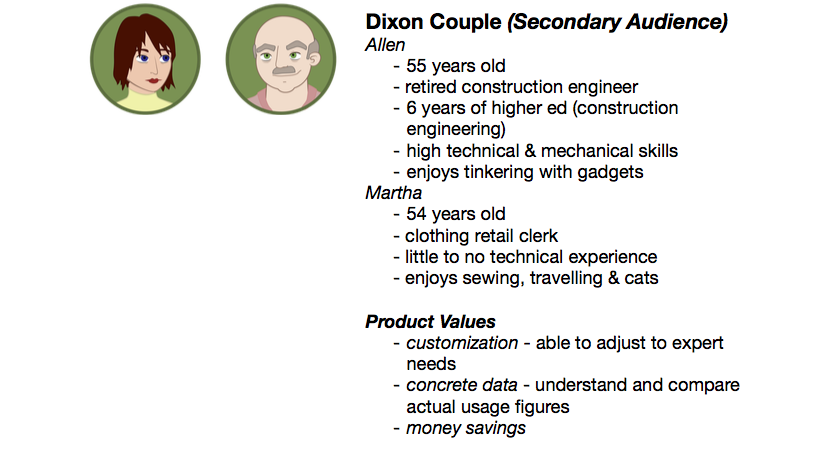
Persona Creation
Personas
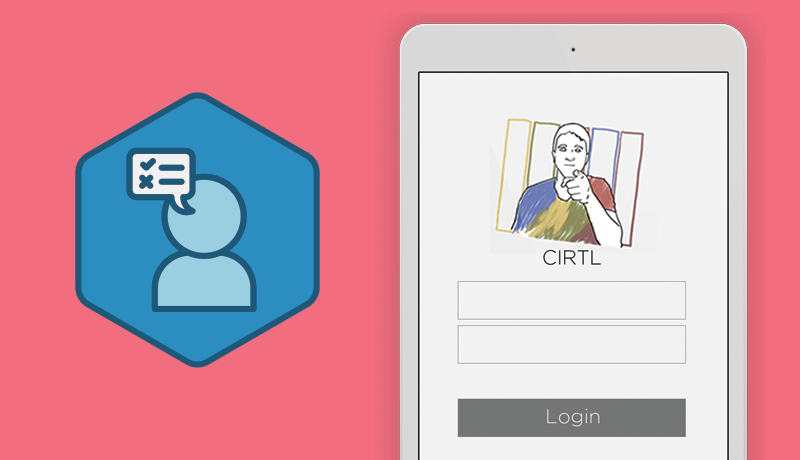
To get into the mind of the users using this method, creating personas is a great way to bring the user-centric design thinking forward.

Sketch out ideas
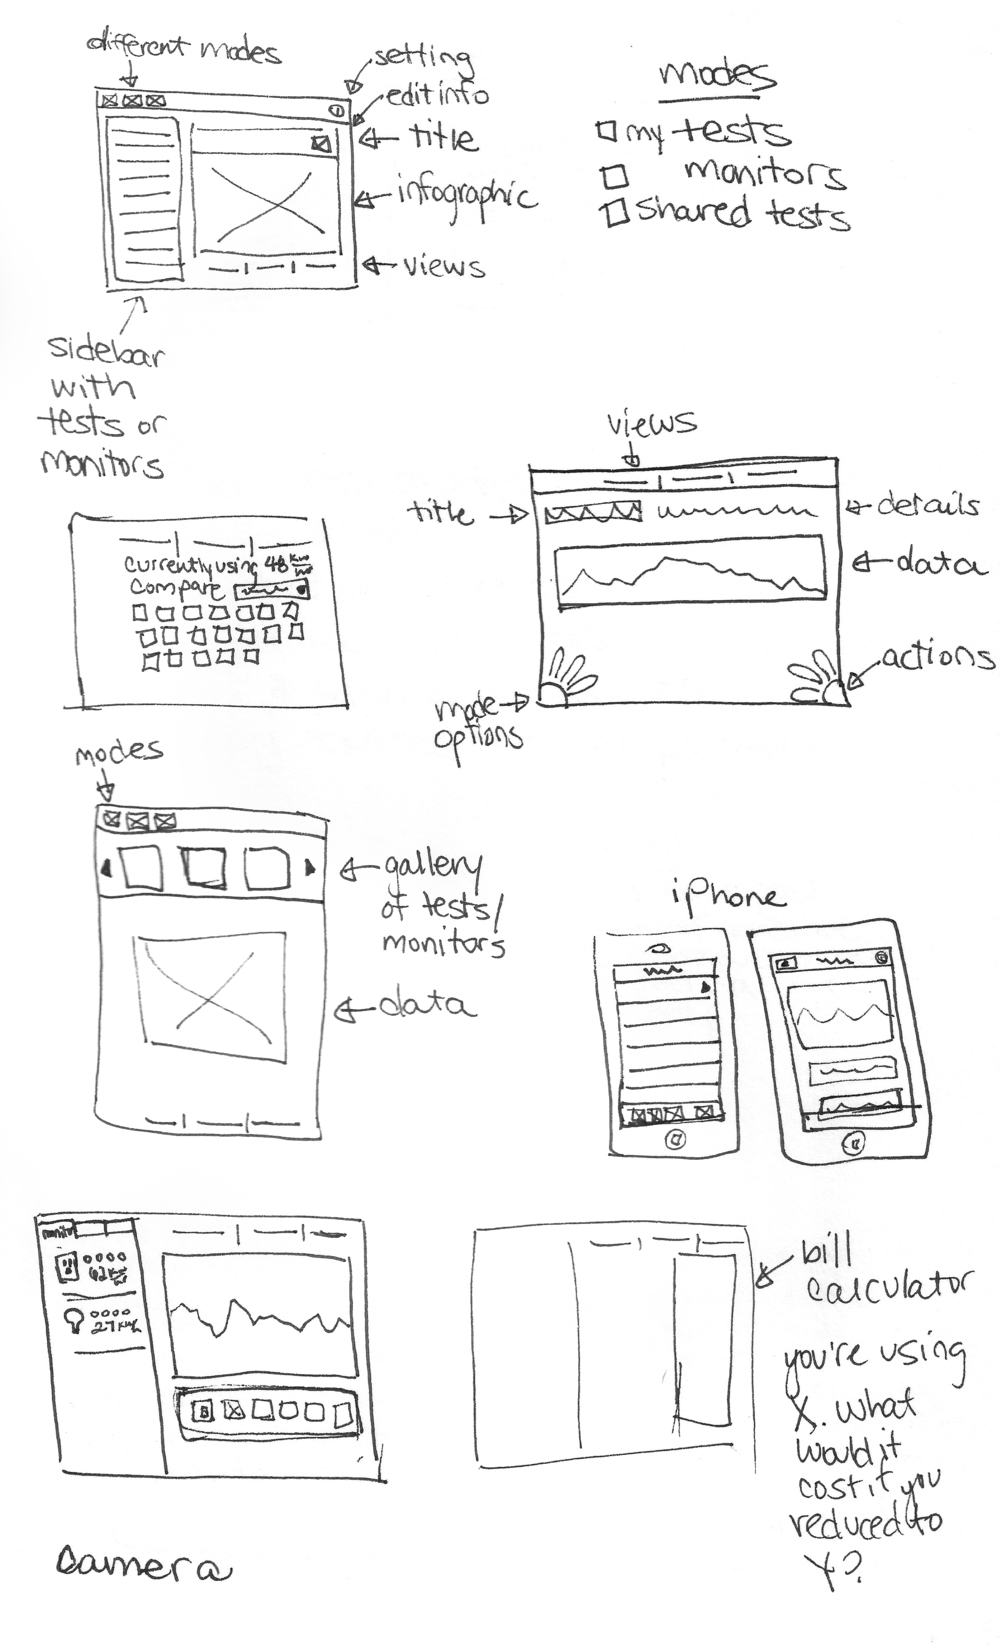
UI MOCK UP SKETCHES
Getting some of the initial discussion points through the personas and into basic user interface components. We explore different modalities and devices.
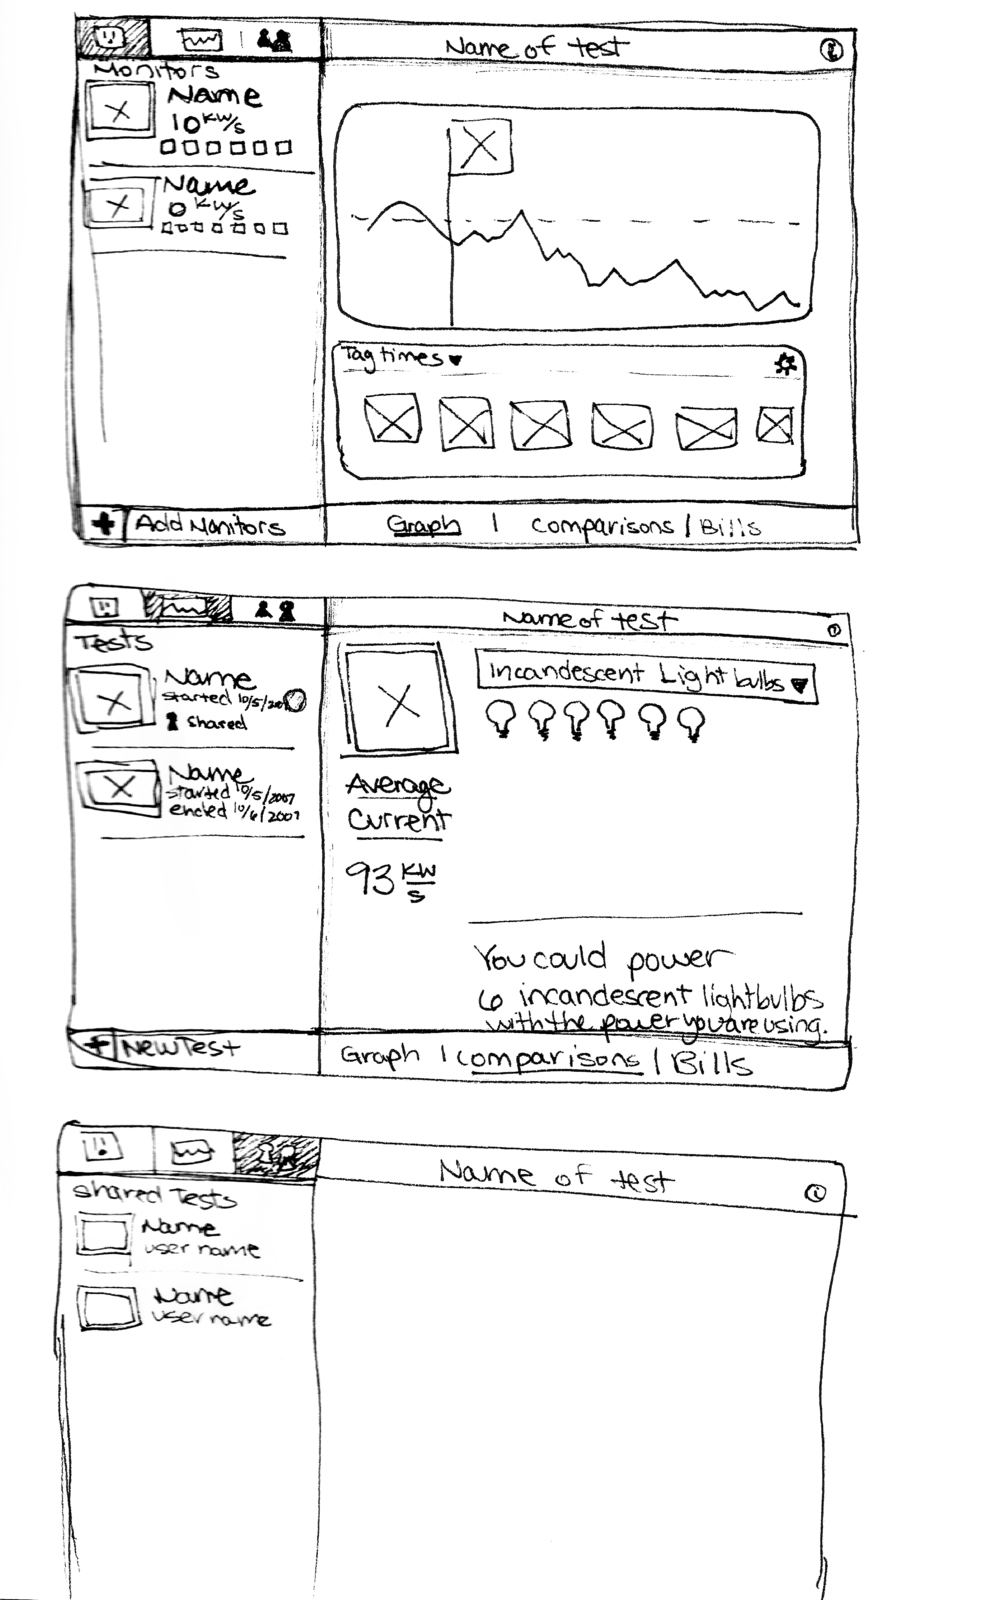
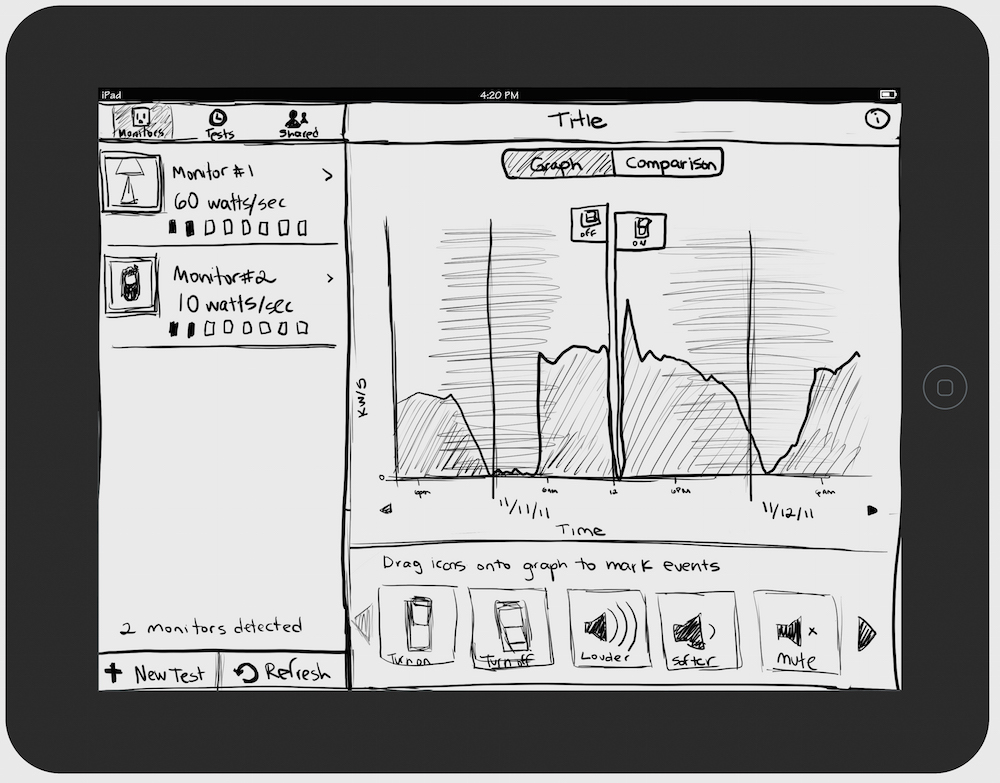
UI LOW FIDELITY SKETCHES
Picking a mobile/tablet platform and narrowing ideas, we continue mocking up the interface into low fidelity mockups.
Prototype the hardware
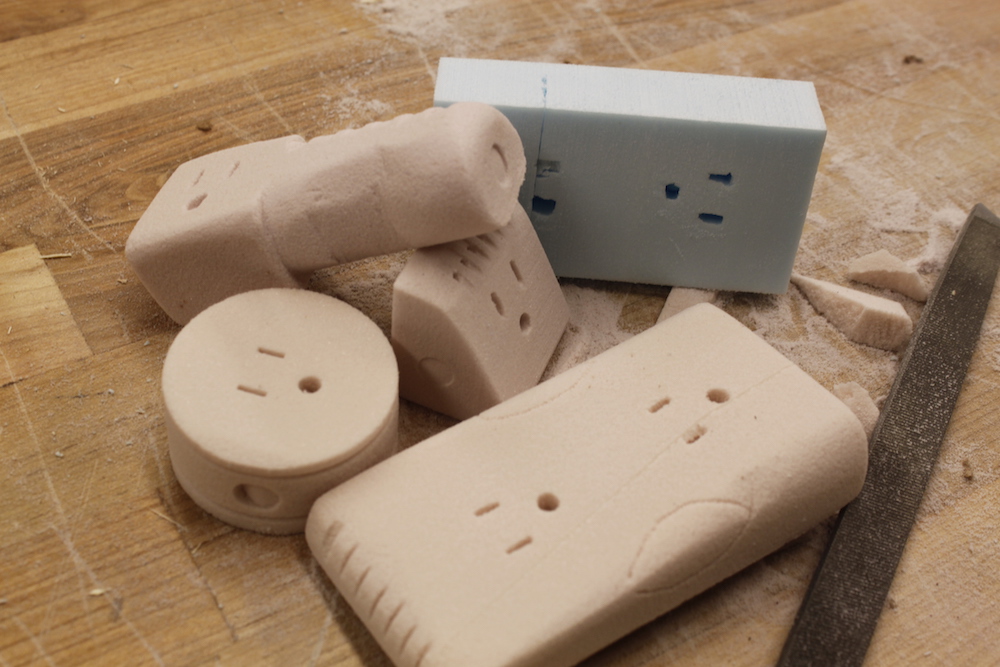
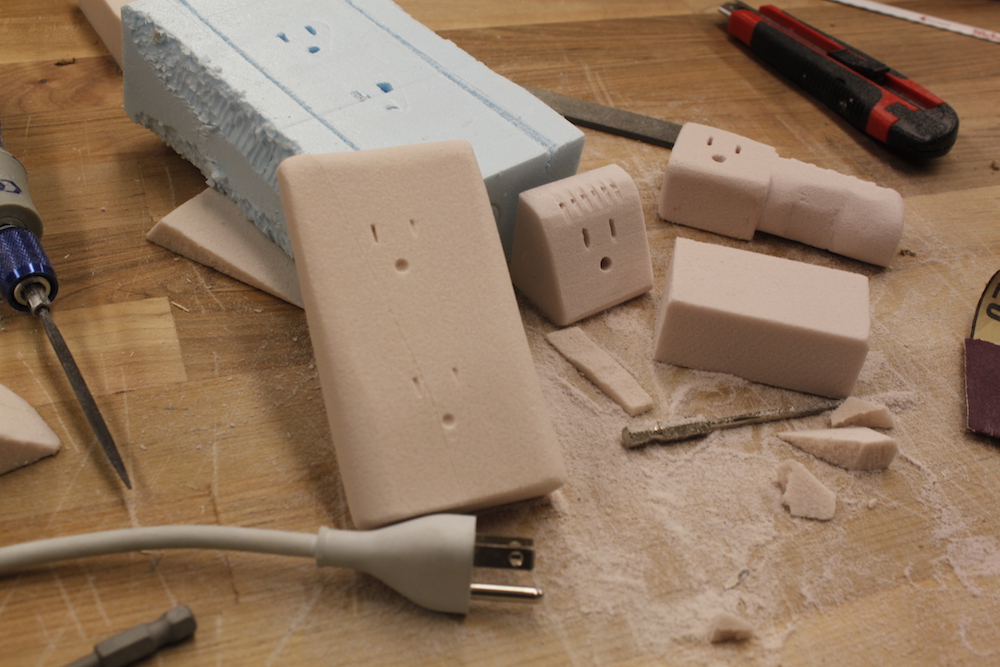
Rapid prototyping with styrofoam for the new shell
Went into the rapid prototyping lab and played with some foam of what the case of the plug side
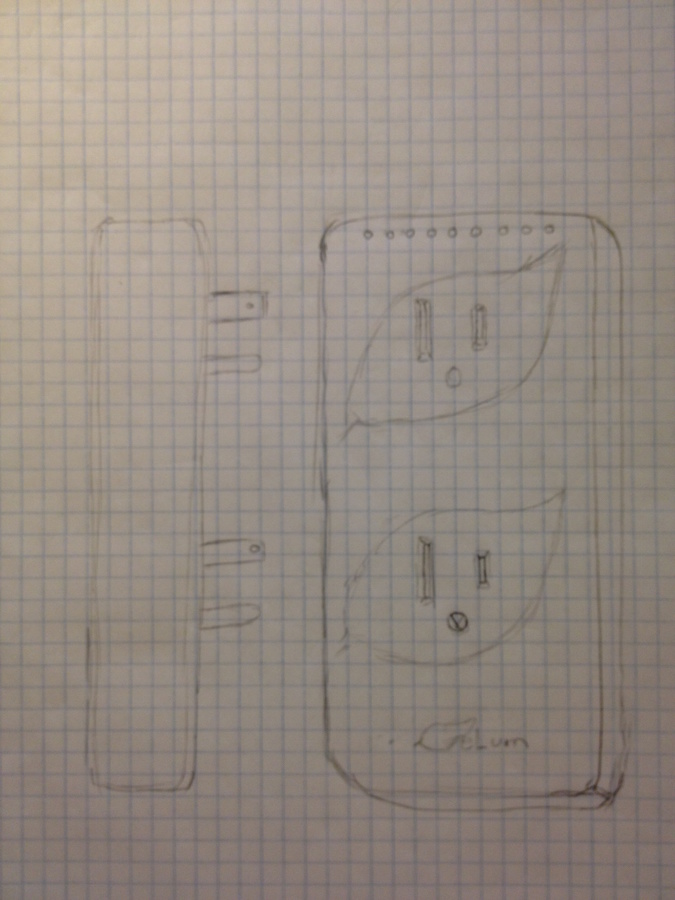
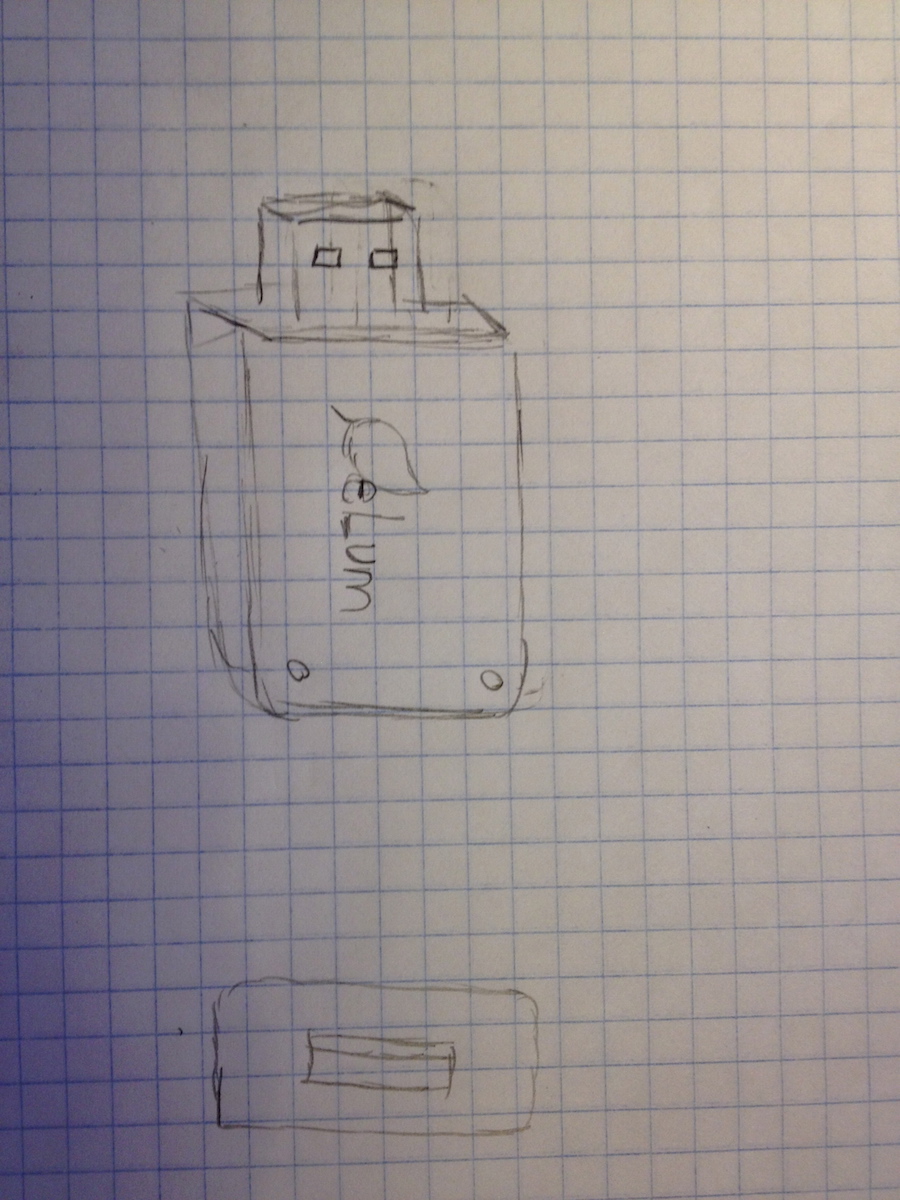
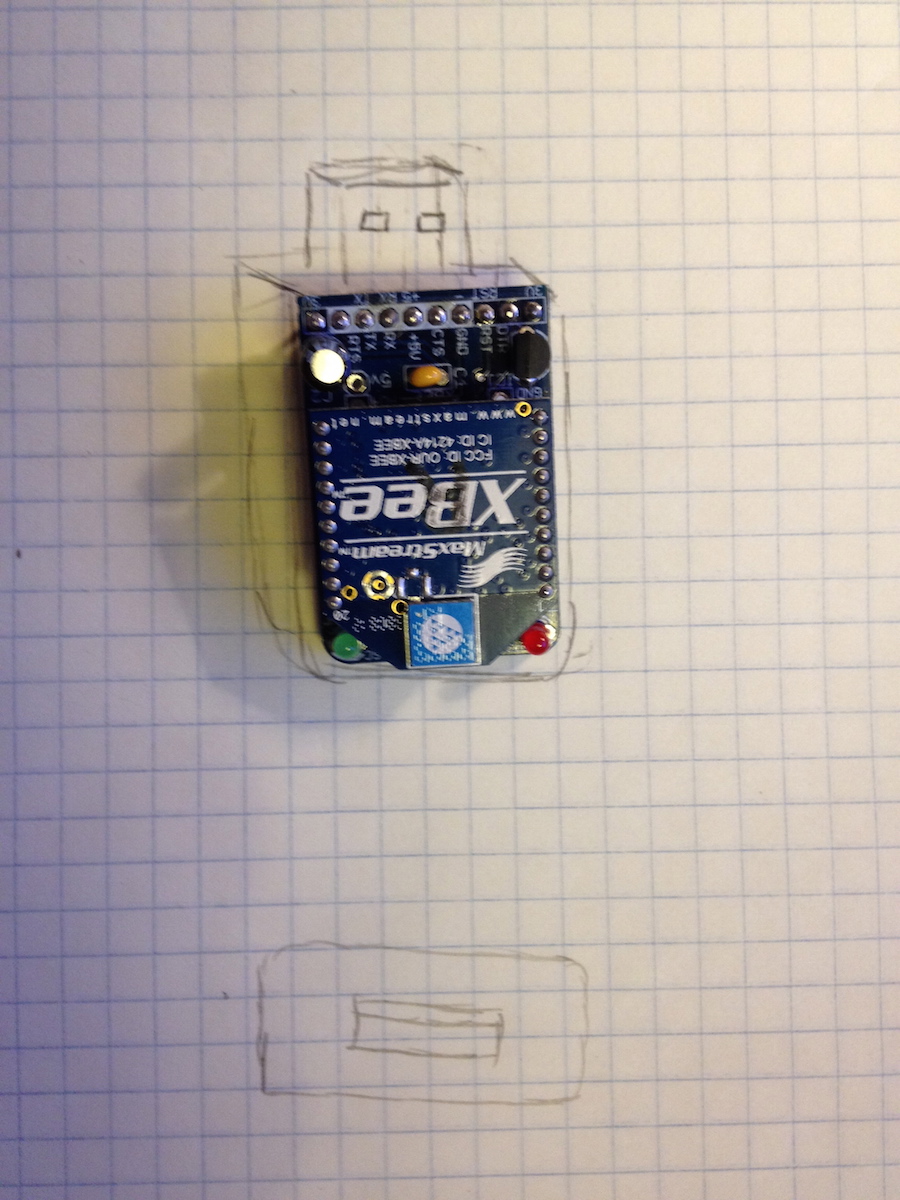
SKETCHES/designs of what the bridge and sending units could look like
Looking at what the individual plugs could look like, and how it will fit the Xbee units in. They are all soldered together and working.
Receiving unit USB
This receiving unit can handle up to 25 plugs data throughout the house and receive the data to send to the cloud.
Putting the prototype together
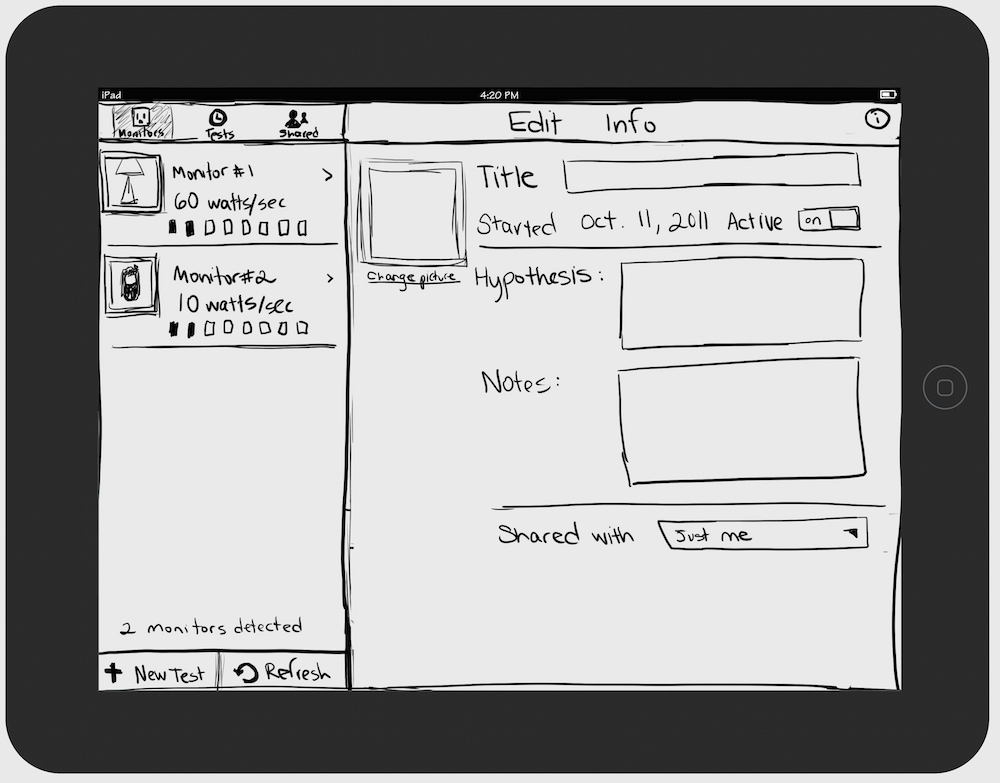
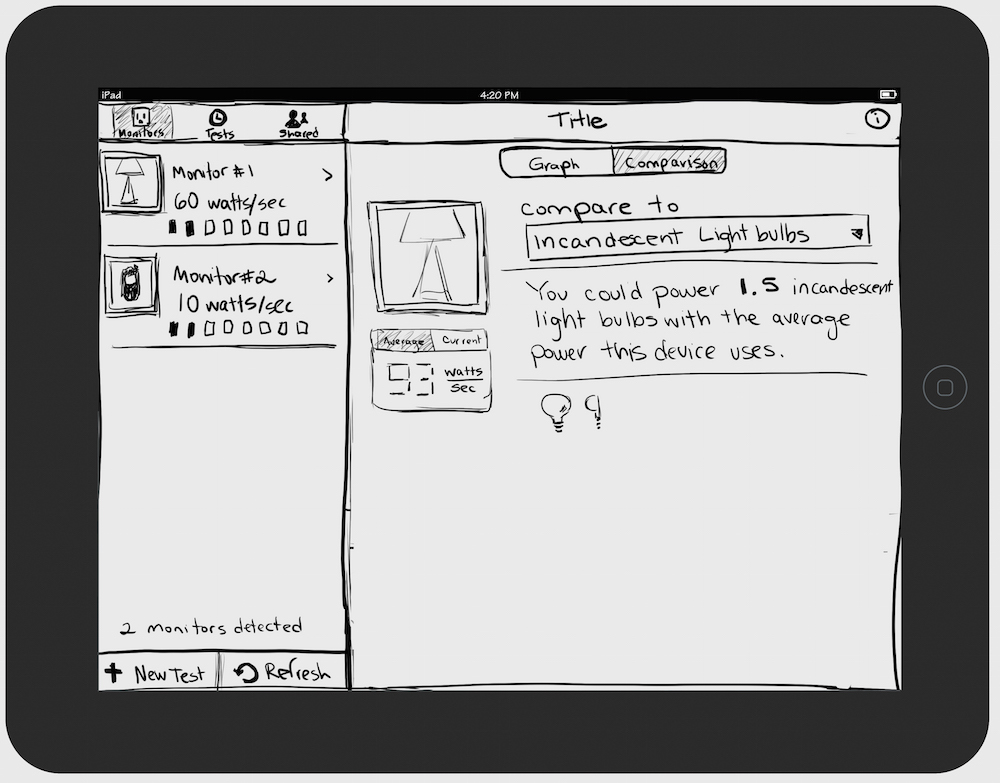
Low to high fidelity
After watching users struggle with the Salesforce app, I reimagined what an interface would look like that would be more efficient. I sketched this up and also show how I hooked it up to a local database with variables. Then translated to code in < 1 day.
Results
Results are positive!
After significant testing, feedback, interviews, user testing of the working product we submitted our project and it did very well. The users understood their energy consumption. A big take away people saw is that even when some items are off, they still draw electricity. (This brought on the idea that the system could auto-shut off the outlet on known downtime.)
This is an area that I am personally very passionate about; I think understanding your habits and making adjustments is something that these kind of interfaces lend to very well.
As of the summer of 2018, there is nothing like this system for the price. The Smarthome push with Alexa and GoogleHome are turning off devices automatically, but not mapping and monitoring actual usage. If users were to understand what take more or less electrical usage, they can schedule useage more effectively.
Our poster conveying the above UX story, methods, and findings